Vikas Burman
Chief Technology Officer
 Space Invaders - A vertical rectangular video game that is a digital representation of a battle between aliens. Not everyone might have played this, but it is understandable from the image here that the point of this game is to Shoot them up!
Three interesting observations we can extract from this classic game to draw some analogies with, when and how we troubleshoot in a technical scenario:
- 1. Troubles if not handled early, will increase (aliens’ speed of descending increases with time).
- 2. In a majority of cases, if not all, there is a pattern that we need to decipher (aliens travel right to left and then down).
- 3. We need to maneuver, aim and then shoot (assess which alien is of what type, which one is near, what it can do, move to that area, aim and then attack).
This brings to the table, three key attributes for any troubleshooting exercise: problem analysis, problem identification and problem rectification.
Troubleshooting (i.e., rectification) in all senses is a chicken-and-egg type of problem, when you need to know how to troubleshoot, you don’t have enough information to know what to do (i.e., identification), and once you have this information, you don’t necessarily need troubleshooting, because you can actually pinpoint the problem based on your own experiences (i.e., analysis). It is a vicious cycle, really.
But as they say, experience builds on practice and to practice, you need to start somewhere. Let’s explore these three simple steps to troubleshoot any type of technical issue you might come across.
1. Problem Analysis
What: Problem analysis starts with defining the problem as clearly as possible. It could be a simple statement or a statement supported by symptoms or constraints or any other supporting details. This definition should serve as single source of truth for the whole duration of troubleshooting exercise.
Where: Once a definition is worded, it needs to be isolated from the larger context to the narrower context. To begin with, there will be multiple probable contexts that may cause the problem. Your past experience, your ability to think in different directions and see possible connections will come handy during this step. Try and think as wild as you can. It’s ok to be wrong and way off, but think through all possible places that could be the reason of the problem.
Why: For each of the identified contexts, think further to identify why this may be the origin of the main problem. Think of various reasons, what could lead to this particular context be the reason of the real problem which you are trying to troubleshoot.
Interestingly, for what part, you just need to ask the right questions to people (if it is not you yourself) who are facing the problem and word them as unambiguously as possible. For where, you need to think in multiple directions, talk to various people (who belong to the scenario) and discuss all possibilities and for why, you can consult multiple subject matter experts to pick all sorts of possible threads. In a nutshell, problem analysis can be a very collaborative and social exercise if done in a structured way.
As an example, let’s see some possible where and why for a sample problem (what) to troubleshoot:
What:
- There is a delay in check-in process of the application.
Where:
- Delay caused by database queries / stored procedures
- Delay caused by server side application
- Delay caused by client side application
- Delay caused by app server infrastructure
- Delay caused by database infrastructure
Why:
- Delay caused by database queries / stored procedures
- Missing index is causing a lengthy table scan
- Inapt use of count(*) at multiple places causing extra data in result set
- Use of dynamic queries restricting caching of execution plan, causing addition delay
- Delay caused by server side application
- Inefficient logging mechanism taking additional time in every request
- Delay caused by client side application
- Service call and UI update is happening in single thread
- Data virtualization in result grid is not done
- Chunky calls to fetch data from server
- Service connection is not pooled
- Delay caused by app server infrastructure
- Inapt hardware capacity
- Inapt configuration settings at web server causing unnecessary delay
- Delay caused by database infrastructure
- Inapt hardware capacity
- Frequent backup policy causing intermittent load
- Inapt database configuration settings causing un-optimized query response time
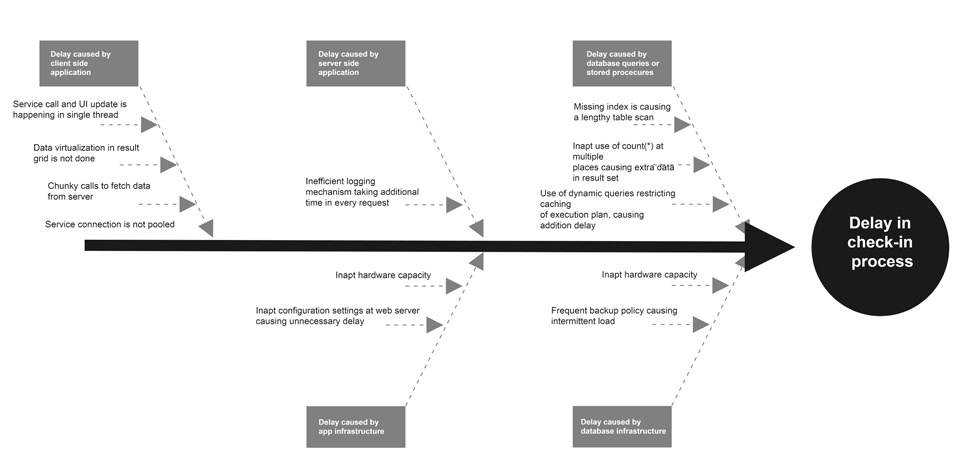
Well, this is cumbersome if we think of writing this list as is. There is a better alternative, called fishbone diagram. Fishbone diagram is an interesting tool to do such problem analysis in a fun and iterative way. There are multiple online and offline tools which let you draw this diagram for storage and retrieval. To begin with, when doing your analysis you can start on a whiteboard and see how soon your analysis will start making sense. A fishbone diagram for discussed problem may look like:

Fig 1: Problem analysis over fishbone diagram
2. Problem Identification
Once you have a certain level of analysis, it’s time to start narrowing down the analyzed space and identify the root cause of the problem. To begin with, you might want to tweak the diagram to re-order the identified cases by following ‘close to far’ principle. The closer the reason is to the ‘what’ the more likely it is the case. And this you can do based on your gut feeling, past experience or all sorts of other exposures that you may have. It may be wrong, but then it’s fine. It will be right the next time, if not this time, you have to start somewhere.
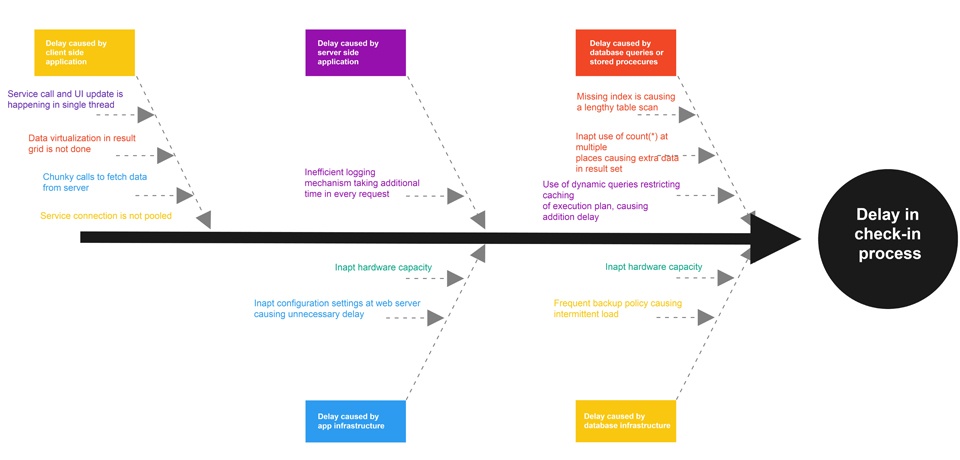
Problem identification is an iterative activity and generally continues from few hours to few days depending upon the scenario you are trying to troubleshoot. For this very reason, you need a snapshot view handy of where you are in your identification process at all times. Color coding identified reasons in the fishbone diagram itself, is the cleanest non-intrusive way to capture this snapshot view as you dig deeper in each of the listed Why. The following could be five status and colors you can use:
- Blue: Case is to be checked.
- Yellow: Identification is in progress.
- Green: Case evaluated and not found to be the reason. It is clean.
- Red: Case found to be true and fix is applied.
- Purple: Case found to be true, but actually not impacting this very problem and therefore deferred for further investigation later.
Same fishbone diagram with snapshot view will look like following, when updated with status of ongoing identification activities.

Fig 2: Problem analysis over fishbone diagram (with status captured)
3. Problem Rectification
The simplest step is to fix the problem when you know it. You may end up having one or more reasons causing the main problem. Once you have fixed those, the troubleshooting is completed successfully. One or more red nodes in your fishbone diagram depicts this successful status.
For some tricky scenarios, even after few red cases, you still may face the problem and this calls for another cycle of 1, 2 and 3 above. However, this time over the existing fishbone diagram to find more Why in each Where or even identify some new Where cases.


